M.A.P.S.
Check out the 2015 Milwaukee Homicide Rate to these Maps at Homicide Tracker
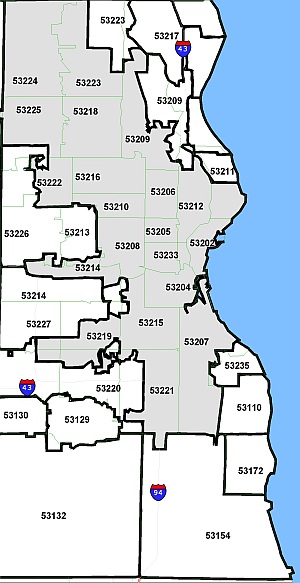
North Central Milwaukee (outlined) is the most segregated area in the most segregated city in the USA, one of the poorest neighborhoods in the fourth poorest city in the USA, and home resident to largest number of African males incarcerated and released, with Wisconsin having the highest black male rate incarceration rate in the nation.
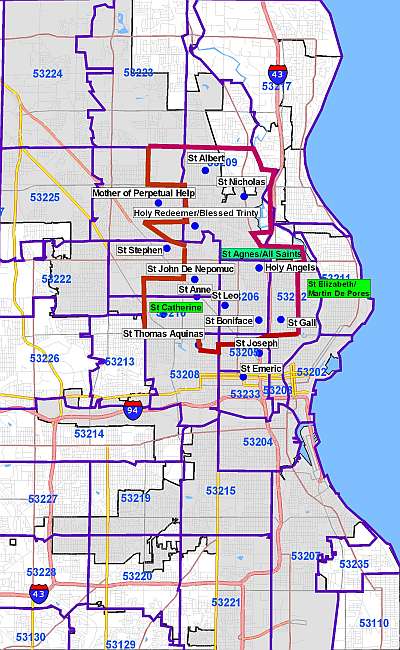
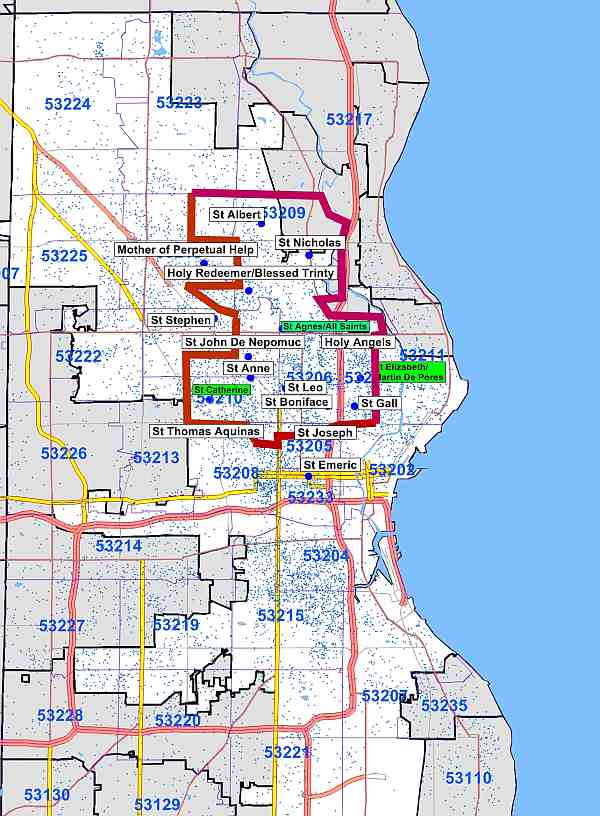
17 Catholic Churches in North Central
Milwaukee in 1962 and 3, in green, today.
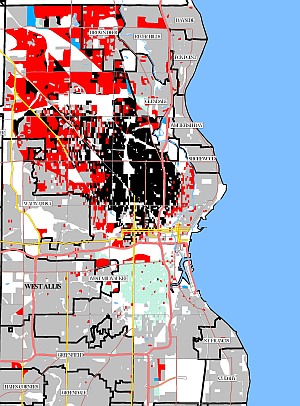
Segregation in North Central Milwaukee
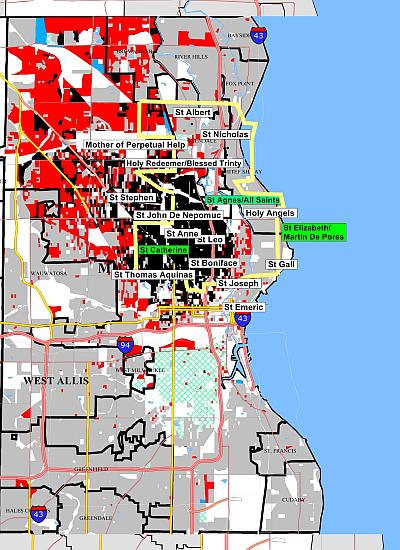
Black=85% or more African American, grey= 85% or more white; red=integrated blocks, green= predominately Hispanic;
white= nonresidential blocksPoverty in North Central Milwaukee
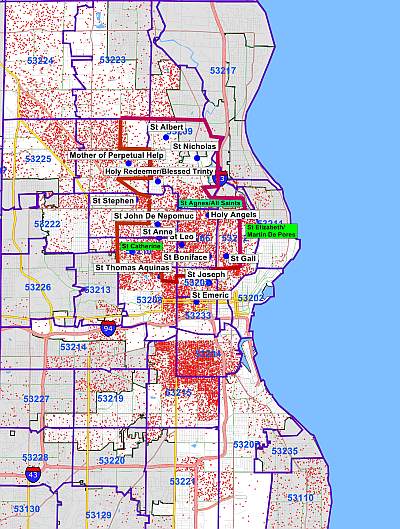
Red dot equal family below poverty levelCriminalization in North Central Milwaukee
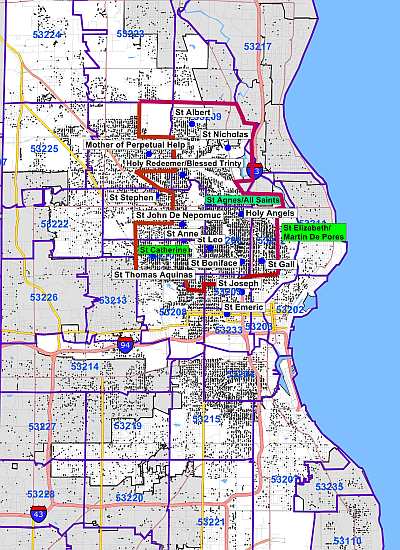
Home Residence of State Prisoners, (Incarcerated and Released)See page 24 of Wisconsins Mass Incarceration of African American Males for Home Residence of African American Male State Prisoners (Incarcerated and Released)
2010 U.S. Census showing Wisconsin having the highest black male incarceration rate in the nation and North Central Milwaukee has the highest rate in the state of Wisconsin. Wisconsins Mass Incarceration of African American Males Prepared by John Pawasarat and Lois M. Quinn, Employment and Training Institute University of Wisconsin, Milwaukee 2013
Unemployment in North Central Milwaukee
1 blue dot = 5 unemployed people as of the most recent 2012 census ACS dataSpecial Thanks for the maps to John Paswsarat of the Employment and Training Institute, University of Wisconsin-Milwaukee
-----------------------------------------------------------------
City of Milwaukee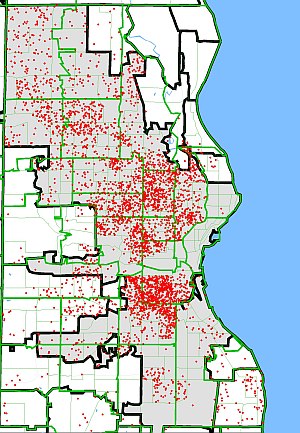
Poverty in Milwaukee
Racial Segregation in Milwaukee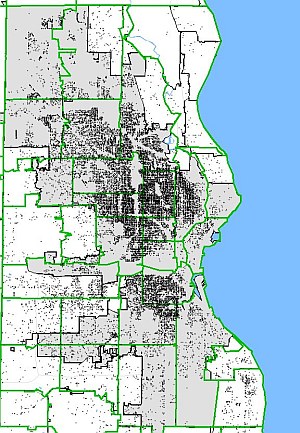
Criminalization in Milwaukee
Criminalization in Milwaukee2


